One central bank publishes what it owns, position by position. It does so
because an American regulator makes it, and it is the only one.
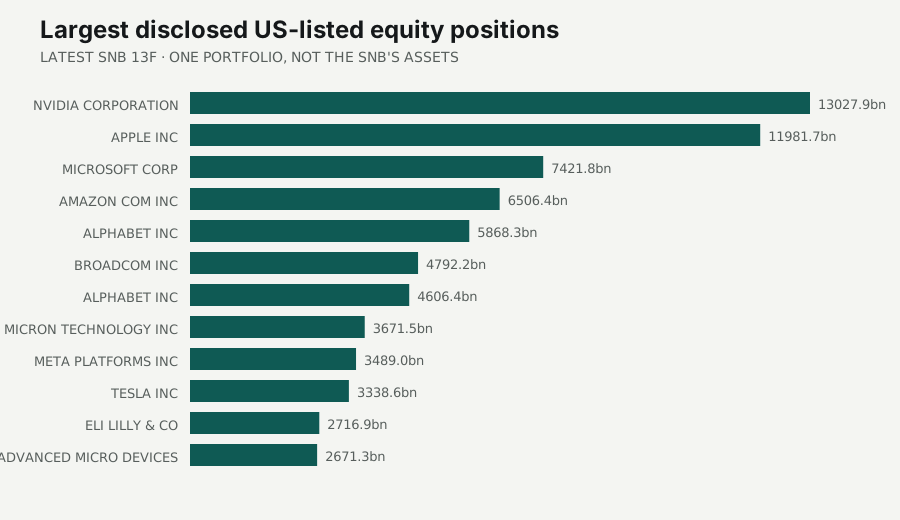
Every quarter the Swiss National Bank files a Form 13F with the US
Securities and Exchange Commission listing
2,301 equity positions by issuer, share
count and market value. It files because it owns US-listed stock and the
rule that catches American asset managers does not exempt foreign monetary
authorities. Nothing about reserve management prompted the disclosure. A
filing requirement written for somebody else did.
The holdings themselves are unremarkable, and that is the point twice over.
A central bank's disclosed equity book turns out to look like the American
market it is a slice of, ranked by size — which is what you would expect of
a portfolio held for diversification rather than for influence. The
remarkable part is that anyone outside the institution can see it at all.
Everything else here arrives at one remove. Gold is a tonnage an authority
reports to a statistical agency, months late and in its own time. Treasury
holdings are assembled from custodians, so the country attached to a
figure is where the security sits rather than who owns it. Currency
composition is published as a world total and nothing finer, because
participation is voluntary and country-level detail is confidential by
design. Of the institutions tracked here,
2 disclose at the level of
individual holdings — and one of those two is a sovereign wealth fund, not
a central bank balance sheet — while
1 publishes nothing
an automated reader can reach.
That narrows the question this page can honestly ask. Not what central
banks hold — nobody outside them knows — but what they can be seen
holding, on whose word, and how much of the movement in that picture is
the picture moving rather than the holdings.
The map takes each reported figure at face value and asks only where it
came from. A solid mark is an authority describing its own position; a
dashed one is a custodian describing it for them, and the mark is sized by
the holding rather than the country. Belgium and Luxembourg carry more
recorded Treasuries than Canada or France — shade the countries in and
that disappears into two slivers, which is the reason for circles.
Underneath sits everything no map can place at all.
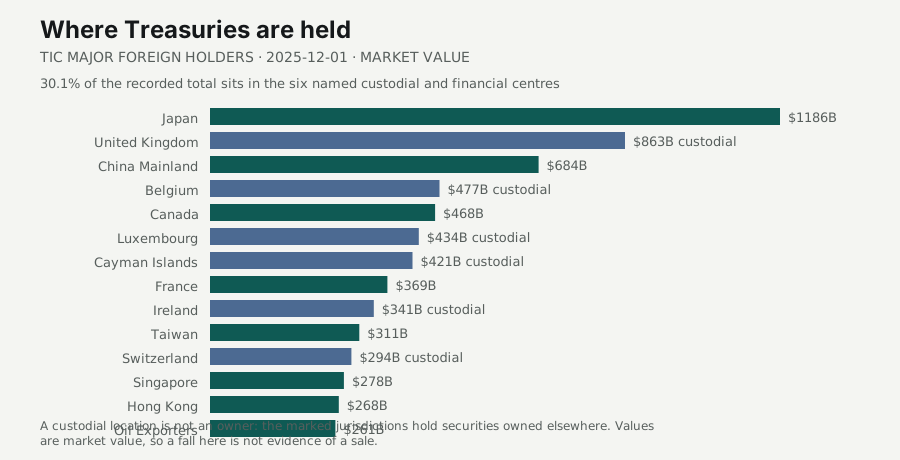
Ranked, the same figures make the custodial problem impossible to miss and
easy to misread. Belgium, Luxembourg, Ireland, the Cayman Islands and
Switzerland sit among the largest recorded holders of US government debt
because a security is recorded where it is kept.
30.1% of the recorded total sits in
centres of that kind, marked here, and nothing on this page attributes a
movement in them to a decision by the country named.
The reserve map
Where reserves are, and where they are only recorded
Scroll to pan the map →
gold, reported by the holderforeign currency, reported by the holderTreasuries, recorded by the custodiancustodial centre
Circle area is the holding, so a large mark on a small country is the point
rather than a drawing error. Gold is tonnes; Treasuries are market-value dollars
recorded by the custodian and foreign currency is dollars reported by the holder.
The three layers are scaled separately and never compared to one another.
Gold as of 2026-08-01, Treasuries 2025-12-01.
Select a country to open the record behind it.
No geography
Every jurisdiction the Treasury currently names can be placed. What has nowhere
to sit is the currency composition — which is itself most of what this page is
about — and an institution that holds reserves without being a country.
8 reporters are drawn at a point, with no
outline beneath them. The 110m boundary file this map is built from is made for a
world view and carries no polygon for Bermuda, Cayman Islands, Hong Kong, Malta, Mauritius, Seychelles, Singapore or
West Bank and Gaza — which is the wrong set to lose, because a custodial
centre or a city-state can carry a holding out of all proportion to its land.
They are placed at the reporting authority's seat, so the position is a claim
about who reports, not about where anything sits.
A further 17 jurisdictions were once named
separately in the Treasury's table and no longer are. A holder is listed only
while it stays large enough to be listed, so falling below that line ends the
series rather than the holding — Bahamas last appeared in
2024, Belgium Luxembourg in
2001. They are not drawn, because
dating a figure that old to 2025-12-01 would be the error the map exists to avoid.
All COFER reporterscurrency composition of allocated reserves, 109 quartersno geography at all — COFER is a voluntary aggregate and economy-level holdings are confidential
European Central Bank508 t of gold · $65B in foreign currencyan institution, not a country
The valuation gap
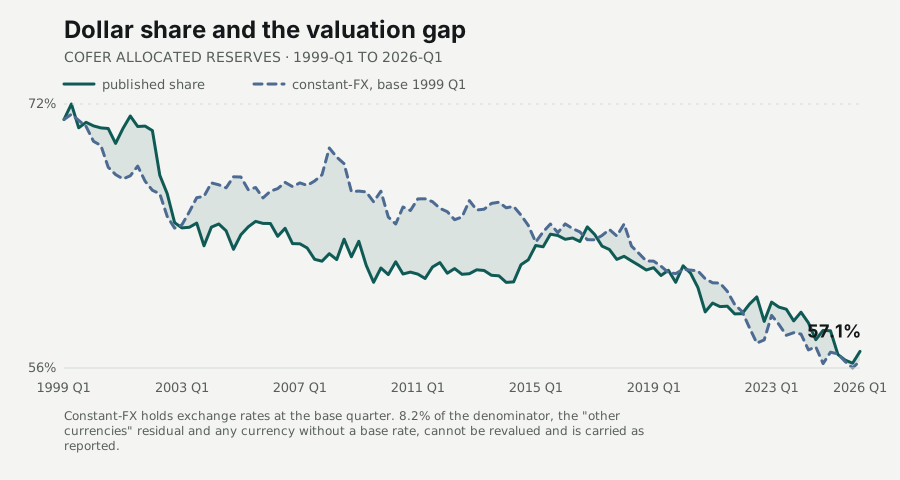
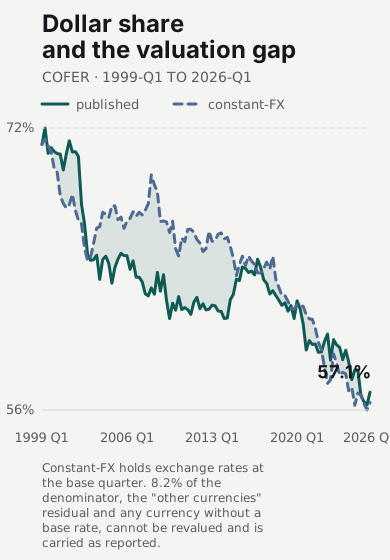
The dollar's published share of allocated reserves is
57.1% at 2026-Q1,
down from the start of the series. That number mixes two different events.
Authorities may hold fewer dollars, and the dollar may have moved against
everything else it is measured beside. Holding exchange rates at the base
quarter separates them: on that basis the share is
56.6%, a difference of
-0.57 points. Sources [8],
[7].
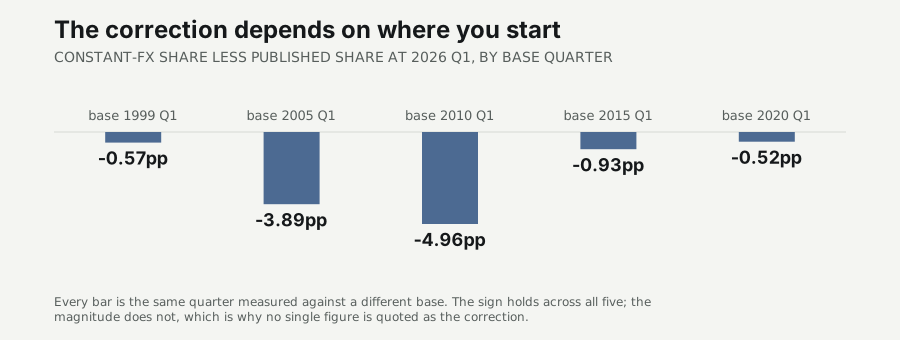
The correction is a construction and the base quarter is a choice.
Measured against 5 different base quarters the gap ranges from
-0.52 points to -4.96 points. The sign holds — every base tested puts
the corrected share below the published one — but the magnitude moves by an
order of magnitude, so no single figure is quoted here as the correction.
Two limits belong with the number rather than after it.
8.2% of the denominator
cannot be revalued at all: the "other currencies" residual has no single
exchange rate, and a currency has no base rate before it entered the
reporting set. Both are carried at their reported dollar value. And the
correction removes exchange-rate valuation only — a euro bond portfolio
also moves in euro terms when euro yields move, and the published data
cannot separate that. The result is closer to a quantity measure than the
published share is. It is not one.
Gold in tonnes
The section above spends its length on a valuation problem. This one does
not have that problem. Official gold is reported as a volume, and a tonne
carries no price, so the quantity question that the currency data can only
approach is answered here directly.
Official gold, reported basis
Net tonnes per year · buying above the line, selling below
2025: 257 t net — 331 t bought against
75 t sold, 78 reporters
bought
sold
reporters
Year incomplete — reporting lags differ and it will revise upward.
Net is gross buying less gross selling across reporters. A reporter with no
observation in a year is excluded from that year rather than counted as
unchanged. The faded final year is incomplete: reporting lags differ and it
will revise upward.
Every year, in figures
Official gold, reported basis. Tonnes.
Year
Net
Bought
Sold
Reporters
2026 *
+139
678
540
77
2025
+257
331
75
78
2024
+249
445
196
79
2023
+363
697
334
78
2022
+252
390
137
77
2021
+284
490
206
79
2020
+248
397
149
78
2019
+501
594
93
78
2018
+366
556
190
77
2017
+474
513
39
75
2016
+173
380
207
74
2015
+337
420
83
70
2014
+216
308
92
67
2013
+297
309
12
64
2012
+363
385
22
60
2011
+395
455
60
59
2010
+156
201
45
58
2009
+233
373
139
55
2008
−161
121
282
53
2007
−462
86
548
52
2006
−258
63
322
48
2005
−412
50
462
45
2004
−359
82
442
44
2003
−390
85
475
42
2002
−363
93
456
37
2001
−361
59
421
38
2000
−119
70
189
34
* Incomplete year.
Across 85 reporting authorities the
reported basis stands at 30,448 tonnes. In
2025, the last complete year,
331 tonnes were bought and
75 tonnes sold, for
257 tonnes net. The chart plots the
net, which is the quantity the debate is about; the gross figures stay in
the text beside it, because one line called central bank demand hides
whoever is on the other side of it and the difference between the two
readings is not something a reader should have to measure by eye.
Source [10].
Read across, the series divides cleanly in two. Every year from 2000 to 2008
is net selling; every year since 2009 is net buying. That turn is visible
without any estimate being added to it, which is the whole argument for
staying on the reported basis.
This is smaller than the figure usually quoted, and the difference is the point.
Compiler estimates of central-bank gold buying run well above the reported
basis, because they add purchases that no authority has reported. Neither
number is wrong. One counts what was disclosed and the other estimates
what was not, and the distance between them is a measurement of the
disclosure gap rather than a disagreement to be reconciled. No estimated
figure enters any total, share or rank on this page.
Two reporters are excluded and named rather than quietly dropped:
AGO and BRA report
volumes above the largest known official holding, so their reporting unit
is not fine troy ounces. Rescaling them on a guess would be worse than
excluding them. Reporting lags differ, so observations from
2026-06-01 are incomplete and will revise upward; the faded
final year on the chart is that window.
Drafted, not endorsed — read before publishing
Conclusions
Everything above is measured: a share computed from reported levels, a
revaluation of those levels at fixed exchange rates, and a tonnage
series. What follows is inference drawn from those measurements, and it
is separated here for the same reason the constructed metric is labelled
as constructed. A reader who accepts the numbers is free to reject the
reading.
The published dollar share flatters the dollar, by an amount the method cannot pin down.
Every base quarter tested puts the constant-exchange-rate share below
the published one, so the direction is not in question. But the size
ranges from -0.52 points to -4.96 points on the same quarter, and
the only thing separating those two answers is where the count starts.
The honest claim is the direction. Anyone quoting a single correction
is quoting their base period.
Gold is the one leg of this measured in a quantity.
Tonnage needs no exchange rate and no price, which is why it can settle
a question the currency data can only bound. Reported accumulation has
been positive and steady rather than dramatic:
257 tonnes net in 2025,
against gross buying of 331 tonnes.
Most of what is recorded was recorded by somebody other than the holder.30.1% of recorded foreign
Treasury holdings sit in six custodial and financial centres, which
means a large share of the most-cited series in this debate describes
where securities are kept rather than who owns them.
Security-level disclosure is a regulatory accident, not a norm.
The one line-by-line view of a central bank's holdings on this page —
2,301 positions at 2026-06-30 — exists because
a US filing requirement reaches a Swiss institution. It covers
US-listed equities only. No authority discloses its reserve portfolio
this way voluntarily.
What this implies
Read a reserve-share headline as a ratio, not a decision.
Both halves move, and the published series cannot tell you which half
did. The quantity questions are answerable where a quantity is reported,
which at present means gold and very little else.
Watch what becomes disclosed, not only what is held.
The binding constraint on this analysis is not data processing. It is
that 10 of the institutions in this build publish nothing an
automated reader can reach, and they are not a random sample of the
world's reserve holders.
What would change this reading
A constant-exchange-rate series that tracks the published share across every base quarter would remove the valuation argument entirely.
Country-level currency composition, from any authority publishing its own, would replace the aggregate node on the map with a real holder and make the diversification question directly measurable.
A benchmark revision that reallocated custodial holdings and left the country pattern unchanged would show the custodial caveat is smaller than 30.1% implies.
Reported gold accumulation converging on compiler estimates would close the disclosure gap and remove this page's strongest observation.
A second authority filing security-level holdings would turn the SNB from an exception into a small class.
How far down each institution publishes
This is the ceiling on everything above. Seven of the
13 institutions tracked here publish a
balance sheet split into components and stop; three publish a single total;
one publishes nothing an automated reader can retrieve. Whether a series is
thin because the institution keeps it that way is a separate question from
whether this build collects it, so the two are kept apart — the ladder is
the first, and the register below it is the second.
How far down each institution publishes
13 institutions · deepest disclosure at the top
Line by line
Individual holdings, named, with size
2of 13
SNB
NBIM
By component
The balance sheet split into categories
7of 13
FED
ECB
BOE
BOC
RBA
RIKSBANK
BANXICO
One total
The size of the balance sheet and nothing inside it
3of 13
BOJ
NORGES
RBI
Nothing reachable
No series an automated reader can retrieve
1of 13
PBOC
Both institutions at the top of the ladder are there by accident rather than
by policy. NBIM is a sovereign wealth fund, which publishes its portfolio
because that is what the fund was set up to do; the Swiss National Bank
appears because a US filing rule reaches it, and only for the US-listed
equities that rule covers. No central bank on this list discloses its reserve
portfolio holding by holding of its own accord.
Every series follows, with its publisher's own identifier, its unit and
scale, its accounting basis, its registered sources and any documented
break. 9 collectors currently return rows and
10 are visibly skipped — counted per adapter, not per
institution, because several institutions have more than one.
Generated series
Inspect the data
All 396 series, named by their own publisher's identifier and
carrying their unit, accounting basis and sources. A wide selection lists
them; narrow to 8 or fewer and each opens in full. Series longer
than 40 observations are thinned for display — the record says
so and gives the true count, and the full series stays in the generated data.
Method
Adapters emit only what a publisher published. Shares, differences and
revaluations are computed after collection, in one place, so they can be
tested. Units are asserted before any arithmetic, every row carries a
source id, an accounting basis and a retrieval vintage, and weekly and
monthly observations are never forward-filled onto one another.
The dollar share is computed from reported levels, not read from a published share.
That keeps the denominator on the page and makes the parse checkable: across all
109 quarters the largest disagreement between the
published allocated total and the sum of its currency components is
4.8e-13 percentage points, which is floating
point rather than a difference.
The constant-exchange-rate share. Each non-dollar holding is
converted back into its own currency at that quarter's rate and revalued at
the base quarter's rate; the dollar leg is unchanged by construction, which
is also the test — at a base equal to the quarter itself the two shares are
identical. Rates are end-of-period from one provider for the whole history,
matching the convention the compiler uses.
Gold accumulation. Period-over-period changes in reported
tonnage, summed across reporters. A reporter with no observation in a year
is excluded from that year rather than counted as unchanged, and the
excluded count travels with the figure.
Asset-class mapping used in this build
Institution
Published series
Mapped class
Accounting basis
FED
WALCL
TOTAL_ASSETS
amortised_cost
FED
TREAST
GOVT_BONDS
amortised_cost
ECB
ILM.W.U2.C.T000000.Z5.Z01
TOTAL_ASSETS
reported
BOE
RPWB75A
TOTAL_ASSETS
reported
BOC
V36651
TOTAL_ASSETS
reported
BOC
V36654
GOVT_BONDS
reported
Limitations
COFER is an aggregate and participation is voluntary. It contains no country-level currency composition and none can be inferred from it, which is why one node on the map is a crowd.
The constant-exchange-rate correction removes exchange-rate valuation only. Bond-price valuation remains inside each currency sleeve and cannot be separated from published data.
8.2% of the denominator cannot be revalued: the other-currencies residual has no single rate, and a currency has no base rate before it entered the reporting set.
The size of the valuation gap depends on the base quarter and varies from -0.52 points to -4.96 points. Only its sign is stable across the bases tested.
Gold tonnage is a disclosure series. A step in it is a reporting event, not a purchase date, and observations from 2026-06-01 are incomplete.
AGO and BRA are excluded from every gold figure because their reported units are not fine troy ounces. Estimated compiler figures enter no computed value.
TIC records custodial location at market value. 30.1% of the recorded total sits in named financial centres, and no movement here is attributed to an owner's decision.
Balance sheets stay in local currency and are indexed because accounting bases differ. No global total is computed.
The Swiss National Bank filing covers US-listed equities only: a slice of one portfolio, not that institution's assets.
10 adapters are skipped in the current manifest, each with a stated reason, and the coverage grid shows which.
The largest reserve holders are the least visible across currency composition, gold reporting timeliness and security-level portfolios at the same time. That is the biggest limitation on this page.
Source register
The register contains 23 probed sources.
“Corrected” means the research lead and the live publisher did not agree, and
the note records the difference.
Bank of England: Central Bank assets totalThe database labels RPWB75A as weekly Central Bank assets total in sterling millions, but its documented CSV route returned no observations for the requested window; the adapter exposes that failure instead of fabricating a series.